![]() Follow me on twitter @bradleyboehmke
Follow me on twitter @bradleyboehmke
![]() Follow me on twitter @bradleyboehmke
Follow me on twitter @bradleyboehmke
As previously mentioned, many organizations still rely on Excel to hold and share data so exporting to Excel is a useful bit of knowledge. And rather than saving to a .csv file to send to a co-worker who wants to work in Excel, its more efficient to just save R outputs directly to an Excel workbook. Since I covered importing data with the xlsx package, I’ll also cover exporting data with this package. However, the readxl package which I demonstrated in the importing data section does not have a function to export to Excel. But there is a lesser known package called r2excel that provides exporting and formatting functions for Excel which I will cover.
Saving a data frame to a .xlsx file is as easy as saving to a .csv file:
library(xlsx)

# write to a .xlsx file
write.xlsx(df, file = "output_example.xlsx")

# write to a .xlsx file without row names
write.xlsx(df, file = "output_example.xlsx", row.names = FALSE)
In some cases you may wish to create a .xlsx file that contains multiple data frames. In this you can just create an empty workbook and save the data frames on seperate worksheets within the same workbook:
# create empty workbook
multiple_df <- createWorkbook()

# create worksheets within workbook
car_df <- createSheet(wb = multiple_df, sheetName = "Cars")
iris_df <- createSheet(wb = multiple_df, sheetName = "Iris")

# add data frames to worksheets; for this example I use the
# built in mtcars and iris data frames
addDataFrame(x = mtcars, sheet = car_df)
addDataFrame(x = iris, sheet = iris_df)

# save as a .xlsx file
saveWorkbook(multiple_df, file = "output_example_2.xlsx")
By default this saves the row and column names but this can be adjusted by adding col.names = FALSE and/or row.names = FALSE to the addDataFrame() function. There is also the ability to do some formatting with the xlsx package. The following provides several examples of how you can edit titles, subtitles, borders, column width, etc.1 Although at first glance this can appear tedious for simple Excel editing, the real benefits present themselves when you integrate this editing into automated analyses.
# create new workbook
wb <- createWorkbook()
#--------------------
# DEFINE CELL STYLES
#--------------------
# title and subtitle styles
title_style <- CellStyle(wb) +
Font(wb, heightInPoints = 16,
color = "blue",
isBold = TRUE,
underline = 1)
subtitle_style <- CellStyle(wb) +
Font(wb, heightInPoints = 14,
isItalic = TRUE,
isBold = FALSE)
# data table styles
rowname_style <- CellStyle(wb) +
Font(wb, isBold = TRUE)
colname_style <- CellStyle(wb) +
Font(wb, isBold = TRUE) +
Alignment(wrapText = TRUE, horizontal = "ALIGN_CENTER") +
Border(color = "black",
position = c("TOP", "BOTTOM"),
pen = c("BORDER_THIN", "BORDER_THICK"))
#-------------------------
# CREATE & EDIT WORKSHEET
#-------------------------
# create worksheet
Cars <- createSheet(wb, sheetName = "Cars")
# helper function to add titles
xlsx.addTitle <- function(sheet, rowIndex, title, titleStyle) {
rows <- createRow(sheet, rowIndex = rowIndex)
sheetTitle <- createCell(rows, colIndex = 1)
setCellValue(sheetTitle[[1,1]], title)
setCellStyle(sheetTitle[[1,1]], titleStyle)
}
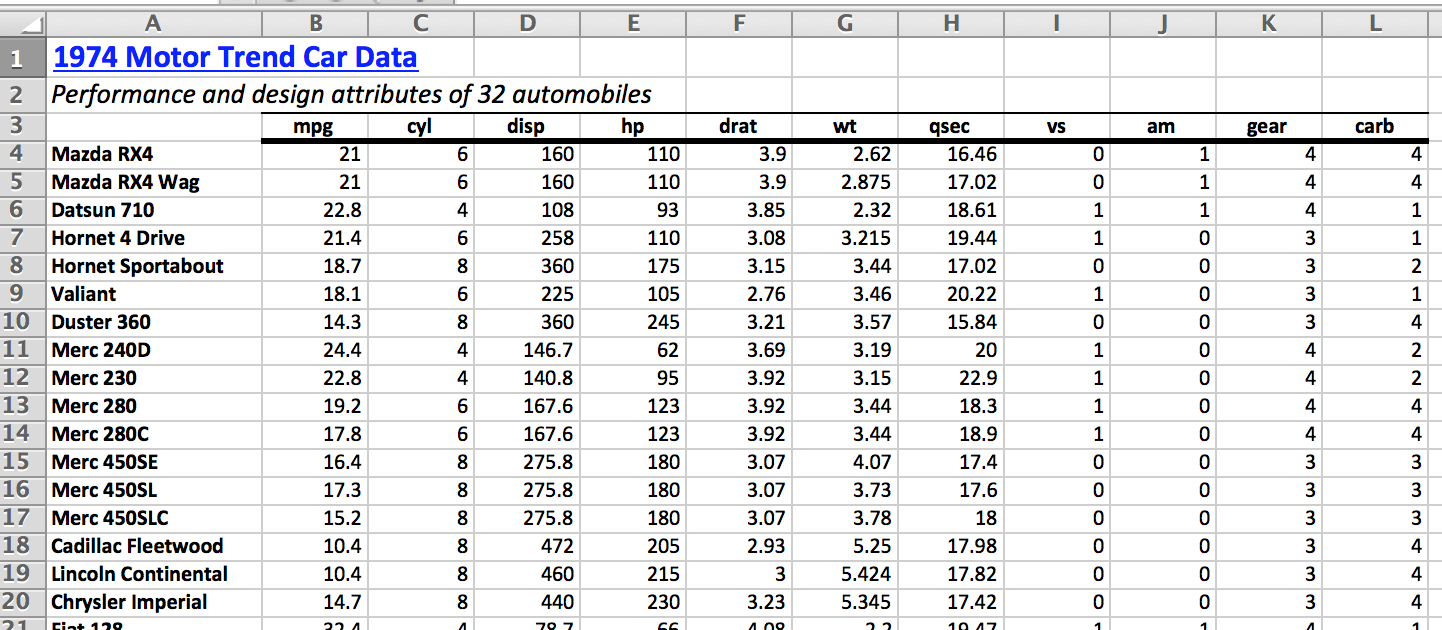
# add title and sub title to worksheet
xlsx.addTitle(sheet = Cars, rowIndex = 1,
title = "1974 Motor Trend Car Data",
titleStyle = title_style)
xlsx.addTitle(sheet = Cars, rowIndex = 2,
title = "Performance and design attributes of 32 automobiles",
titleStyle = subtitle_style)
# add data frame to worksheet
addDataFrame(mtcars, sheet = Cars, startRow = 3, startColumn = 1,
colnamesStyle = colname_style,
rownamesStyle = rowname_style)
# change row name column width
setColumnWidth(sheet = Cars, colIndex = 1, colWidth = 18)
# save workbook
saveWorkbook(wb, file = "output_example_3.xlsx")
Although Formatting Excel files using the xlsx package is possible, the last section illustrated that it is a bit cumbersome. For this reason, A. Kassambara created the r2excel package which depends on the xlsx package but provides easy to use functions for Excel formatting. The following provides a simple example but you can find many additional formatting functions here
# install.packages("devtools")
devtools::install_github("kassambara/r2excel")
library(r2excel)
# create new workbook
wb <- createWorkbook()
# create worksheet
Casualties <- createSheet(wb, sheetName = "Casualties")
# add title
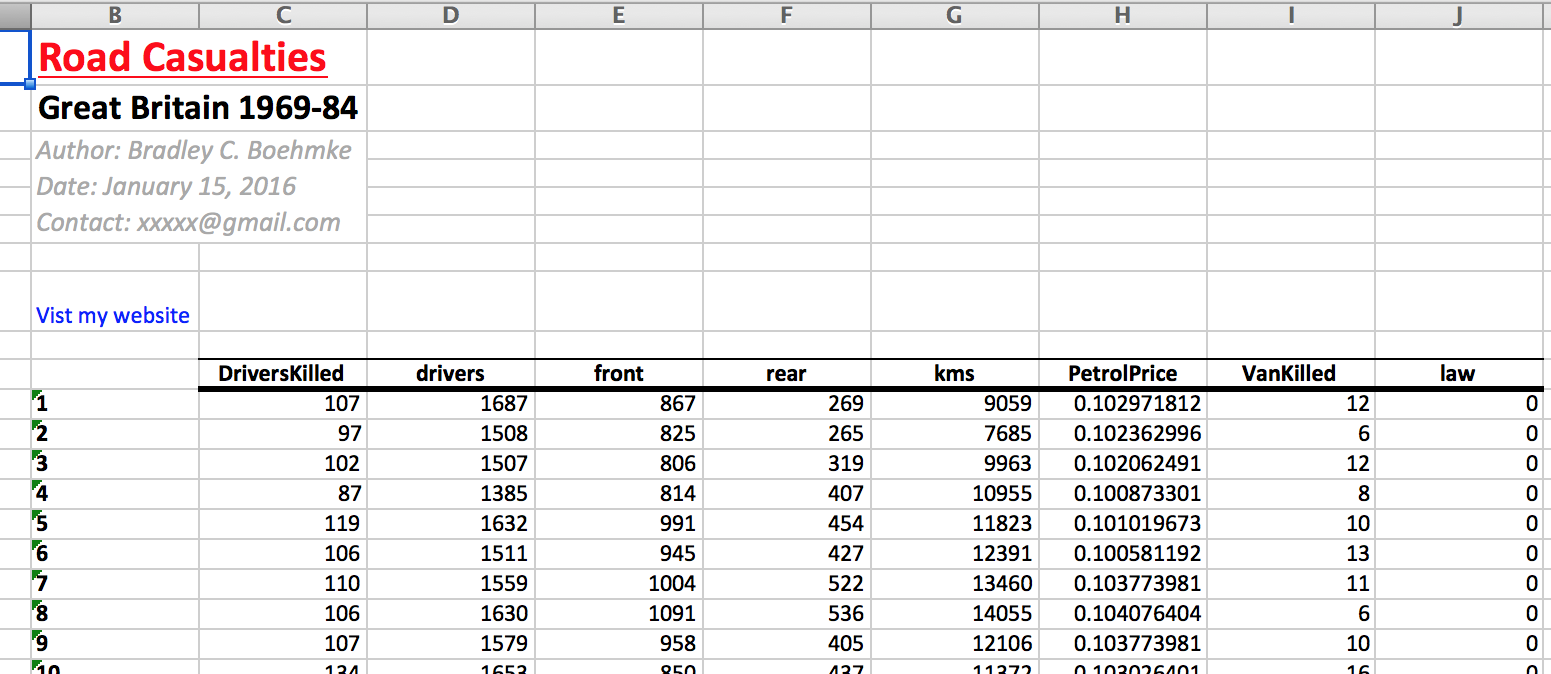
xlsx.addHeader(wb, sheet = Casualties,
value = "Road Casualties",
level = 1,
color = "red",
underline = 1)
# add subtitle
xlsx.addHeader(wb, sheet = Casualties,
value = "Great Britain 1969-84",
level = 2,
color = "black")
# add author information
author = paste("Author: Bradley C. Boehmke \n",
"Date: January 15, 2016 \n",
"Contact: xxxxx@gmail.com", sep = "")
xlsx.addParagraph(wb, sheet = Casualties,
value = author,
isItalic = TRUE,
colSpan = 2,
rowSpan = 4,
fontColor = "darkgray",
fontSize = 14)
# add hyperlink
xlsx.addHyperlink(wb, sheet = Casualties,
address = "http://bradleyboehmke.github.io/",
friendlyName = "Vist my website", fontSize = 12)
xlsx.addLineBreak(sheet = Casualties, 1)
# add data frame to worksheet, I'm using the built in
# Seatbelt data which you can view at data(Seatbelt)
xlsx.addTable(wb, sheet = Casualties, data = Seatbelts, startCol = 2)
# save the workbook to an Excel file
saveWorkbook(wb, file = "output_example_4.xlsx")
This example was derived from STHDA. Additional options, such as adding plot outputs can be found at STHDA and also in the XML and Web Technologies for Data Sciences with R book. ↩