![]() Follow me on twitter @bradleyboehmke
Follow me on twitter @bradleyboehmke
![]() Follow me on twitter @bradleyboehmke
Follow me on twitter @bradleyboehmke
“Water, water, everywhere, nor any a drop to drink” - Samuel Taylor Coleridge
Synonymous to Samuel Taylor Coleridge’s quote in Rime of the Ancient Mariner, the degree to which data are useful is largely determined by an analysts ability to wrangle data. In spite of advances in technologies for working with data, analysts still spend an inordinate amount of time obtaining data, diagnosing data quality issues and pre-processing data into a usable form. Research has illustrated that this portion of the data analysis process is the most tedious and time consuming component; often consuming 50-80% of an analyst’s time1. Despite the challenges, data wrangling remains a fundamental building block that enables visualization and statistical modeling. Only through data wrangling can we make data useful. Consequently, one’s ability to perform data wrangling tasks effectively and efficiently is fundamental to becoming an expert data analyst in their respective domain.
So what exactly is this thing called data wrangling? Its the ability to take a messy, unrefined source of data and wrangle it into something useful. It’s the art of using computer programming to extract raw data and creating clear and actionable bits of information for your analysis. Data wrangling is the entire front end of the analytic process and requires numerous tasks that can be categorized within the get, clean, and transform components.
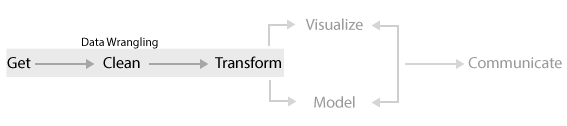
However, learning how to wrangle your data does not necessarily follow a linear progression as suggested by the above figure. In fact, you need to start from scratch to understand how to work with data in R. Consequently, this course takes a meandering route through the data wrangling process to help build a solid data wrangling foundation.
First, modern day data wrangling requires being comfortable writing code. If you are new to writing code, R or RStudio you need to understand some of the basics of working in the “command line” environment. Although you received a short introduction to R in the Intro to R Bootcamp, this course will re-introduce you to R, discuss the benefits it provides, and get you comfortable at the command line. In addition, you will learn how to manage your R workflow to ensure future work is reproducible.
Second, data wrangling requires the ability to work with different forms of data. Analysts and organizations are finding new and unique ways to leverage all forms of data so it’s important to be able to work not only with numbers but also with character strings, categorical variables, logical variables, regular expression, and dates. This course will explain how to work with these different types of data.
Third, modern day datasets often contain variables of different lengths and/or classes. Furthermore, many statistical and mathematical calculations operate on different types of data structures. Consequently, data wrangling requires a strong knowledge of the different structures to hold your datasets. This course will cover the different types of data structures available in R, how they differ by dimensionality and how to create, add to, and subset the various data structures. You will also learn how to deal with missing values in data structures.
Fourth, data are arriving from multiple sources at an alarming rate and analysts and organizations are seeking ways to leverage these new sources of information. Consequently, analysts need to understand how to get data from these sources. Furthermore, since analysis is often a collaborative effort analysts also need to know how to share their data. This course will cover the basics of importing tabular and spreadsheet data, scraping data stored online, and exporting data for sharing purposes.
Fifth, minimizing duplication and writing simple and readable code is important to becoming an effective and efficient data analyst. Moreover, clarity should always be a goal throughout the data analysis process. Throughout this course you will be introduced to the art of writing functions and using loop control statements to reduce redundancy in code. You will also learn how to simplify your code using pipe operators to make your code more readable. Consequently, this will help you to perform data wrangling tasks more effectively, efficiently, and with more clarity.
Sixth, data wrangling is all about getting your data into the right form in order to feed it into the visualization and modeling stages. This typically requires a large amount of reshaping and transforming of your data. Throughout this course you will learn the fundamental functions for “tidying” your data and for manipulating, sorting, summarizing, and joining your data. These tasks will help to significantly reduce the time you spend on the data wrangling process.
Lastly, although external to the data wrangling process visualization is a key component that all analysts need to be fluent in. Consequently, throughout this course you will spend plenty of time learning to properly visualize your data.
Individually, these capabilities provide you important tools for performing individual data wrangling tasks. Combined, these tools will help to make you more effective and efficient in the front end of the data analysis process so that you can spend more of your time visualizing and modeling your data and communicating your results!