![]() Follow me on twitter @bradleyboehmke
Follow me on twitter @bradleyboehmke
![]() Follow me on twitter @bradleyboehmke
Follow me on twitter @bradleyboehmke
A hybrid between a bar chart and a Cleveland dot plot is the lollipop chart. A lollipop chart typically contains categorical variables on the y-axis measured against a second (continuous) variable on the x-axis. Similar to the Cleveland dot plot, the emphasis is on the dot to draw the readers attention to the specific x-axis value achieved by each category. The line is meant to be a minimalistic approach to easily tie each category to its relative point without drawing too much attention to the line itself. A lollipop chart is great for comparing multiple categories as it aids the reader in aligning categories to points but minimizes the amount of ink on the graphic.
![]()
This tutorial introduces the basics of the lollipop chart and compares them to bar charts and dot plots. I also show how to go from a basic lollipop chart to a more refined, publication worthy graphic. If you’re short on time jump to the sections of interest:
To reproduce the code throughout this tutorial you will need to load the following packages. The primary package of interest is ggplot2, which is a plotting system for R. You can build lollipop charts with base R graphics, but when I’m building more refined graphics I lean towards ggplot2. Note that I use the development version of ggplot2 which offers some nice title, subtitle, and caption options which I cover in the last section. You can download the development version with this line of code: devtools::install_github("hadley/ggplot2")
library(dplyr)          # for data manipulation
library(tidyr)          # for data tidying
library(ggplot2)        # for generating the visualizations
In addition, throughout the tutorial I illustrate the graphics with the midwest data set provided in the ggplot2 package.
head(midwest)
## # A tibble: 6 x 28
##     PID    county state  area poptotal popdensity popwhite popblack
##   <int>     <chr> <chr> <dbl>    <int>      <dbl>    <int>    <int>
## 1   561     ADAMS    IL 0.052    66090  1270.9615    63917     1702
## 2   562 ALEXANDER    IL 0.014    10626   759.0000     7054     3496
## 3   563      BOND    IL 0.022    14991   681.4091    14477      429
## 4   564     BOONE    IL 0.017    30806  1812.1176    29344      127
## 5   565     BROWN    IL 0.018     5836   324.2222     5264      547
## 6   566    BUREAU    IL 0.050    35688   713.7600    35157       50
## # ... with 20 more variables: popamerindian <int>, popasian <int>,
## #   popother <int>, percwhite <dbl>, percblack <dbl>, percamerindan <dbl>,
## #   percasian <dbl>, percother <dbl>, popadults <int>, perchsd <dbl>,
## #   percollege <dbl>, percprof <dbl>, poppovertyknown <int>,
## #   percpovertyknown <dbl>, percbelowpoverty <dbl>,
## #   percchildbelowpovert <dbl>, percadultpoverty <dbl>,
## #   percelderlypoverty <dbl>, inmetro <int>, category <chr>
Most readers would have little problem understanding either of the basic versions of the lollipop chart, dot plot or the bar chart. Consider if we want to view the top 25 counties in Ohio for percentage of college educated folks. After a little data manipulation (note that I order the counties by percent college educated (percollege) and then make the county variable a factor with the levels ordered accordingly; this will allow us to order the bars and dots in the following charts appropriately)…
ohio_top25 <- midwest %>%
        filter(state == "OH") %>%
        select(county, percollege) %>%
        arrange(desc(percollege)) %>%
        top_n(25) %>%
        arrange(percollege) %>%
        mutate(county = factor(county, levels = .$county))
We could view the data as a horizontal bar chart…
# bar chart
ggplot(ohio_top25, aes(county, percollege)) +
        geom_bar(stat = "identity") +
        coord_flip()

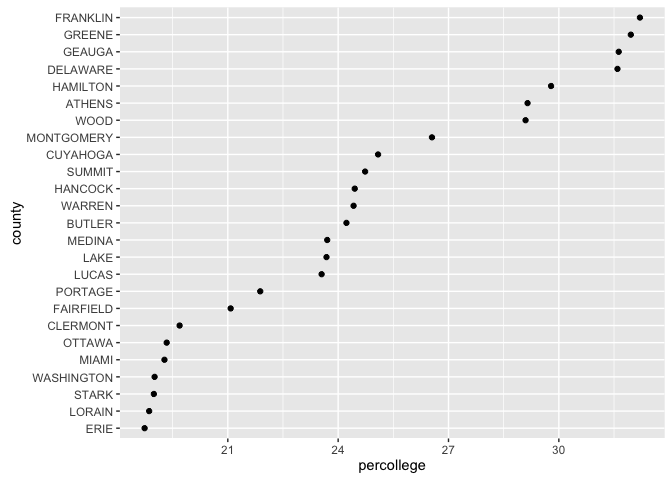
as a dot plot…
# dot plot
ggplot(ohio_top25, aes(percollege, county)) +
        geom_point()
or as a lollipop chart. In the lollipop chart we use geom_segment to plot the lines and we explicitly state that we want the lines to start at x = 0 and extend to the percollege value with xend = percollege. We simply need to include y = county and yend = county to tell R the lines are horizontally attached to each county.
# lollipop chart
ggplot(ohio_top25, aes(percollege, county)) +
        geom_segment(aes(x = 0, y = county, xend = percollege, yend = county), color = "grey50") +
        geom_point()

Consider the case where we want to compare counties in Ohio to see how they differ from the state average. For this the emphasis becomes the state average so we can do a data manipulation to generate the state average value and test if each county above or below that value.
ohio <- midwest %>%
        filter(state == "OH") %>%
        select(county, percollege) %>%
        arrange(percollege) %>%
        mutate(Avg = mean(percollege, na.rm = TRUE),
               Above = ifelse(percollege - Avg > 0, TRUE, FALSE),
               county = factor(county, levels = .$county))

head(ohio)
## # A tibble: 6 x 4
##   county percollege      Avg Above
##   <fctr>      <dbl>    <dbl> <lgl>
## 1 VINTON   7.913256 16.89045 FALSE
## 2  ADAMS   8.741730 16.89045 FALSE
## 3  NOBLE   8.845888 16.89045 FALSE
## 4 HOLMES   9.330709 16.89045 FALSE
## 5  PERRY  10.107671 16.89045 FALSE
## 6 MONROE  10.513927 16.89045 FALSE
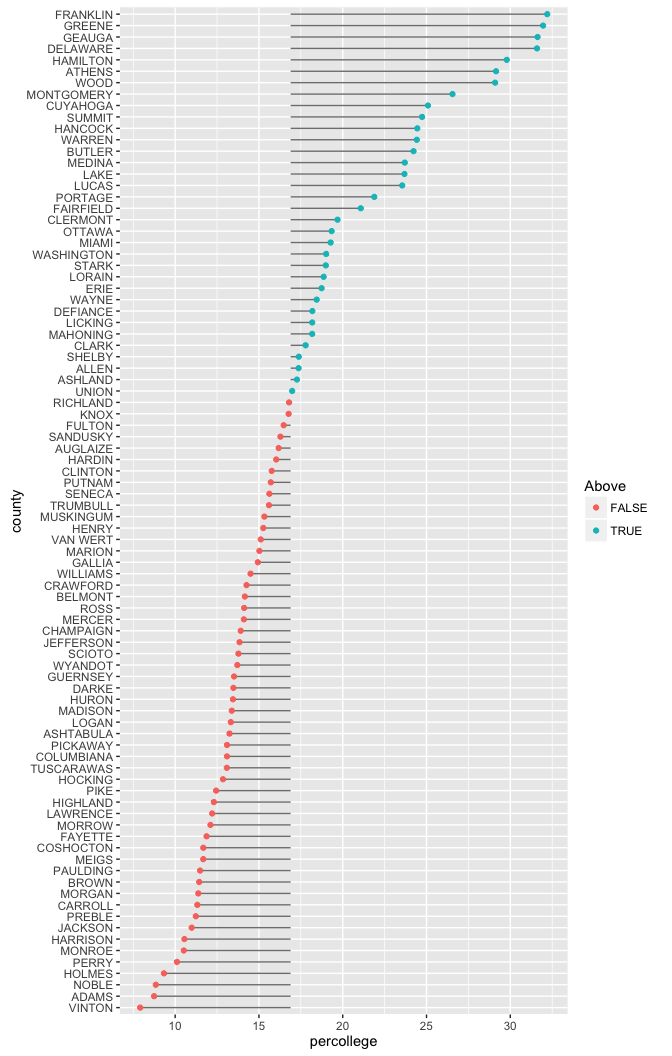
We can now incorporate this data into graphic by mapping the x = argument within geom_segment to the state average and then color the counties based on if they are above or below average.
ggplot(ohio, aes(percollege, county, color = Above)) +
        geom_segment(aes(x = Avg, y = county, xend = percollege, yend = county), color = "grey50") +
        geom_point()
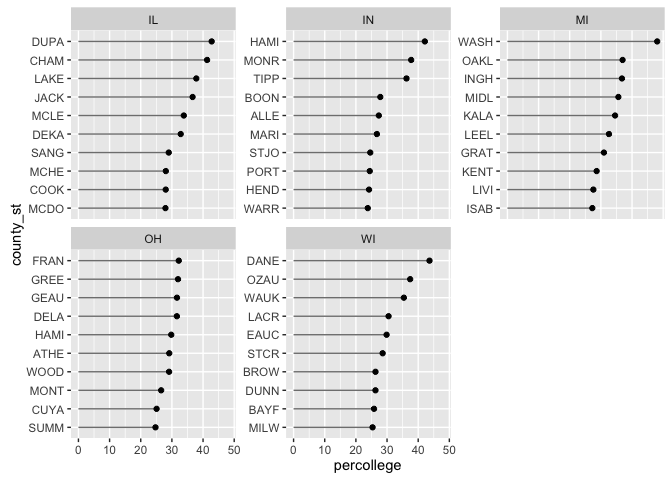
Another comparison approach is if we wanted to compare the top 10 counties for each of the midwest states in our data set. In this case we have to do additional manipulation as each state has a couple county names that are common.
top10 <- midwest %>%
        select(state, county, percollege) %>%
        group_by(state) %>%
        arrange(desc(percollege)) %>%
        top_n(10) %>%
        arrange(percollege) %>%
        unite(county_st, county, state, remove = FALSE) %>%
        mutate(county_st = factor(county_st, levels = .$county_st))

head(top10)
## Source: local data frame [6 x 4]
## Groups: state [2]
##
##      county_st state    county percollege
##         <fctr> <chr>     <chr>      <dbl>
## 1   WARRICK_IN    IN   WARRICK   23.81557
## 2 HENDRICKS_IN    IN HENDRICKS   24.22003
## 3    PORTER_IN    IN    PORTER   24.45589
## 4 ST JOSEPH_IN    IN ST JOSEPH   24.61167
## 5    SUMMIT_OH    OH    SUMMIT   24.73314
## 6  CUYAHOGA_OH    OH  CUYAHOGA   25.08539
We can now plot our data and facet by state to get small multiples representing the top 10 counties for each state. Here I abbreviate the names for brevity.
ggplot(top10, aes(percollege, county_st)) +
         geom_segment(aes(x = 0, y = county_st, xend = percollege, yend = county_st), color = "grey50") +
        geom_point() +
        scale_y_discrete(labels = abbreviate) +
        facet_wrap(~ state, scales = "free_y")
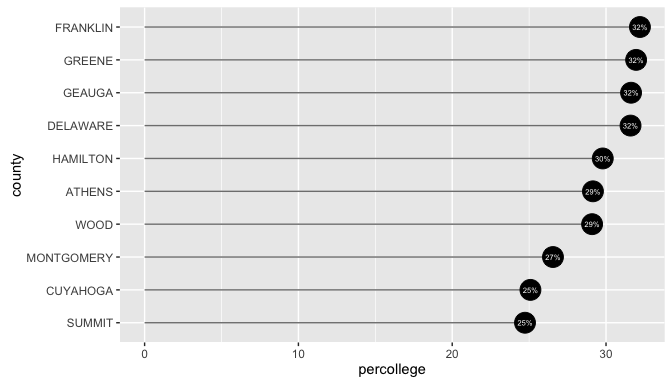
Depending on the number of categories (i.e. counties) you are trying to graphically display, and the range of the x-axis, it can be helpful to add value markers to the points to clarify the difference between the points.
OH_top10 <- midwest %>%
        select(state, county, percollege) %>%
        filter(state == "OH") %>%
        arrange(desc(percollege)) %>%
        top_n(10) %>%
        arrange(percollege) %>%
        mutate(county = factor(county, levels = .$county))

ggplot(OH_top10, aes(percollege, county, label = round(percollege, 1))) +
         geom_segment(aes(x = 0, y = county, xend = percollege, yend = county), color = "grey50") +
        geom_point() +
        geom_text(nudge_x = 1.5)

Alternatively you can enlarge the dots to include the labelling inside of them.
ggplot(OH_top10, aes(percollege, county, label = paste0(round(percollege, 0), "%"))) +
         geom_segment(aes(x = 0, y = county, xend = percollege, yend = county), color = "grey50") +
        geom_point(size = 7) +
        geom_text(color = "white", size = 2)
Now let’s take one of these outputs and create a nice, publication worthy graphic. Here I take the graphic above that compares the percent of college educated adults in Ohio counties to the state average and do a little refinement. I use geom_segment and annotate to create a more simplified and appealing legend, add a title, subtitle and caption followed by some basic theme adjustments.
ggplot(ohio, aes(percollege/100, county, color = Above)) +
        geom_segment(aes(x = Avg/100, y = county, xend = percollege/100, yend = county), color = "grey50") +
        geom_point() +
        annotate("text", x = .25, y = "ALLEN", label = "Above Average", color = "#00BFC4", size = 3, hjust = -0.1, vjust = .75) +
        annotate("text", x = .25, y = "FULTON", label = "Below Average", color = "#F8766D", size = 3, hjust = -0.1, vjust = -.1) +
        geom_segment(aes(x = .25, xend = .25 , y = "ASHLAND", yend = "DEFIANCE"),
                     arrow = arrow(length = unit(0.2,"cm")), color = "#00BFC4") +
        geom_segment(aes(x = .25, xend = .25 , y = "KNOX", yend = "PUTNAM"),
                     arrow = arrow(length = unit(0.2,"cm")), color = "#F8766D") +
        scale_x_continuous(labels = scales::percent, expand = c(0, 0), limits = c(.07, .33)) +
        labs(title = "College Educated Adults in Ohio Counties",
             subtitle = "The average percent of college educated adults in Ohio is 16.89%. Franklin, Greene, Geauga, and \nDelaware counties lead Ohio with over 30% of their adults being college educated while Vinton, \nAdams, Holmes, and Perry trailing with less than 10% of their adults being college educated.",
             caption = "U.S. Census Bureau: 2000 Census") +
        theme_minimal() +
        theme(axis.title = element_blank(),
              panel.grid.minor = element_blank(),
              legend.position = "none",
              text = element_text(family = "Georgia"),
              axis.text.y = element_text(size = 8),
              plot.title = element_text(size = 20, margin = margin(b = 10), hjust = 0),
              plot.subtitle = element_text(size = 12, color = "darkslategrey", margin = margin(b = 25, l = -25)),
              plot.caption = element_text(size = 8, margin = margin(t = 10), color = "grey70", hjust = 0))

Lollipop charts are a nice alternative to bar charts and dot plots. As previously mentioned, when trying to visualize data across many categories they, much like dot plots, provide a nice minimalistic visualization of the data.