28 Mar 2018
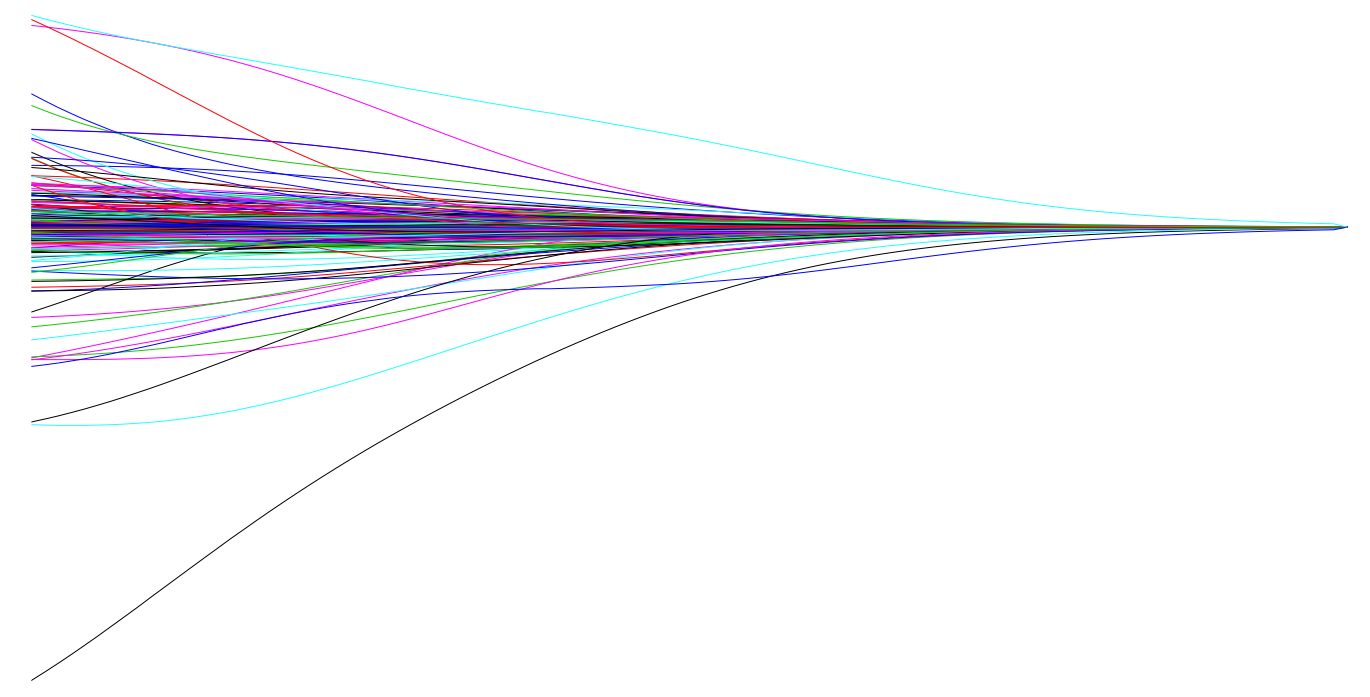 Linear regression is a simple and fundamental approach for supervised learning. Moreover, when the assumptions required by ordinary least squares (OLS) regression are met, the coefficients produced by OLS are unbiased and, of all unbiased linear techniques, have the lowest variance. However, in today’s world, data sets being analyzed typically have a large amount of features. As the number of features grow, our OLS assumptions typically break down and our models often overfit (aka have high variance) to the training sample, causing our out of sample error to increase. Regularization methods provide a means to control our regression coefficients, which can reduce the variance and decrease out of sample error. This latest tutorial explains why you should know this technique and how to implement it in R.
22 Jan 2018
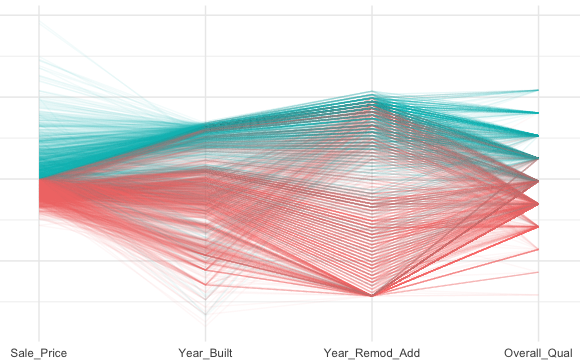
Visual data exploration is a mandatory intial step whether or not more formal analysis follows. When combined with descriptive statistics, visualization provides an effective way to identify summaries, structure, relationships, differences, and abnormalities in the data. Often times no elaborate analysis is necessary as all the important conclusions required for a decision are evident from simple visual examination of the data. Other times, data exploration will be used to help guide the data cleaning, feature selection, and sampling process. Regardless, visual data exploration is about investigating the characteristics of your data set. To do this, we typically create numerous plots in an interactive fashion. This tutorial will show you how to create plots that answer some of the fundamental questions we typically have of our data.
16 Oct 2017
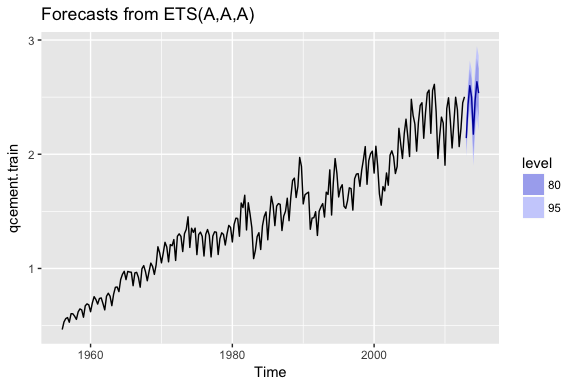 Exponential forecasting models are smoothing methods that have been around since the 1950s and are extremely effective. Where niave forecasting places 100% weight on the most recent observation and moving averages place equal weight on k values, exponential smoothing allows for weighted averages where greater weight can be placed on recent observations and lesser weight on older observations. Exponential smoothing methods are intuitive, computationally efficient, and generally applicable to a wide range of time series. Consequently, exponentially smoothers are great forecasting tools to have and this tutorial will walk you through the basics.
27 Sep 2017
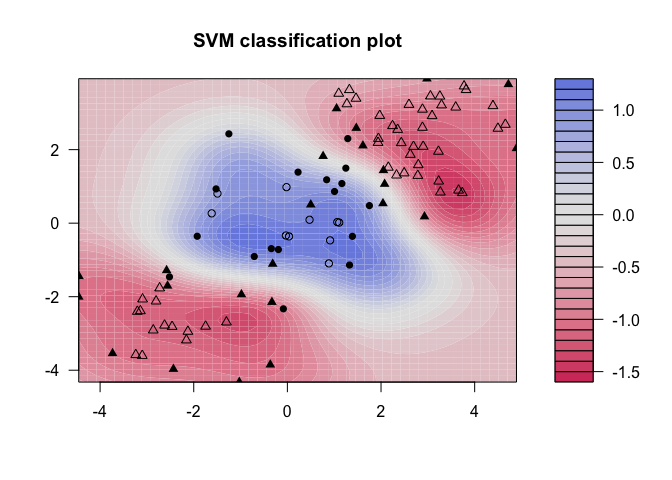 The advent of computers brought on rapid advances in the field of statistical classification, one of which is the Support Vector Machine, or SVM. The goal of an SVM is to take groups of observations and construct boundaries to predict which group future observations belong to based on their measurements. The different groups that must be separated will be called “classes”. SVMs can handle any number of classes, as well as observations of any dimension. SVMs can take almost any shape (including linear, radial, and polynomial, among others), and are generally flexible enough to be used in almost any classification endeavor that the user chooses to undertake. This new tutorial will introduce you to this supervised classification technique.
07 Sep 2017
 Artificial neural networks (ANNs) describe a specific class of machine learning algorithms designed to acquire their own knowledge by extracting useful patterns from data. ANNs are function approximators, mapping inputs to outputs, and are composed of many interconnected computational units, called neurons. Each individual neuron possesses little intrinsic approximation capability; however, when many neurons function cohesively together, their combined effects show remarkable learning performance. A new set of tutorials introduce you to this popular analytic technique.