![]() Follow me on twitter @bradleyboehmke
Follow me on twitter @bradleyboehmke
![]() Follow me on twitter @bradleyboehmke
Follow me on twitter @bradleyboehmke
Although many fundamental data processing functions exist in R, they have been a bit convoluted to date and have lacked consistent coding and the ability to easily flow together. This leads to difficult-to-read nested functions and/or choppy code. R Studio is driving a lot of new packages to collate data management tasks and better integrate them with other analysis activities. As a result, a lot of data processing tasks are becoming packaged in more cohesive and consistent ways, which leads to:
tidyr is a one such package which was built for the sole purpose of simplifying the process of creating tidy data. This tutorial provides you with the basic understanding of the four fundamental functions of data tidying that tidyr provides:
gather() makes “wide” data longerspread() makes “long” data widerseparate() splits a single column into multiple columnsunite() combines multiple columns into a single columninstall.packages("tidyr")
library(tidyr)
Although not required, the tidyr and dplyr packages make use of the pipe operator %>% developed by Stefan Milton Bache in the R package magrittr. Although all the functions in tidyr and dplyr can be used without the pipe operator, one of the great conveniences these packages provide is the ability to string multiple functions together by incorporating %>%.
This operator will forward a value, or the result of an expression, into the next function call/expression. For instance a function to filter data can be written as:
Both functions complete the same task and the benefit of using %>% is not evident; however, when you desire to perform multiple functions its advantage becomes obvious. For more info check out the %>% tutorial.
Objective: Reshaping wide format to long format
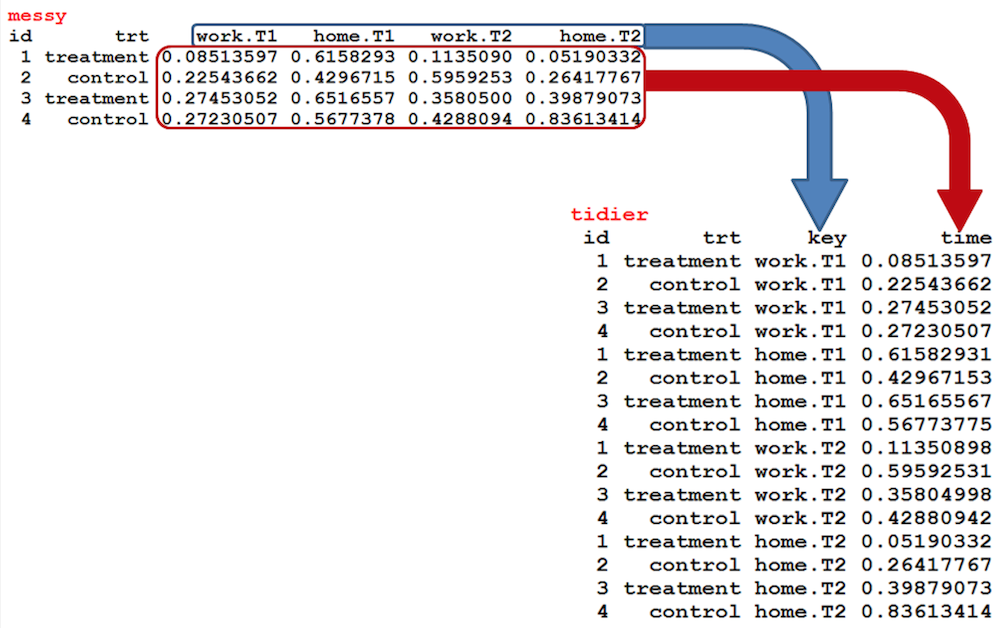
Description: There are times when our data is considered unstacked and a common attribute of concern is spread out across columns. To reformat the data such that these common attributes are gathered together as a single variable, the gather() function will take multiple columns and collapse them into key-value pairs, duplicating all other columns as needed.
Function:       gather(data, key, value, ..., na.rm = FALSE, convert = FALSE)
Same as:        data %>% gather(key, value, ..., na.rm = FALSE, convert = FALSE)

Arguments:
        data:           data frame
        key:            column name representing new variable
        value:          column name representing variable values
        ...:            names of columns to gather (or not gather)
        na.rm:          option to remove observations with missing values (represented by NAs)
        convert:        if TRUE will automatically convert values to logical, integer, numeric, complex or factor as appropriate
☛ This function is a complement to spread()
Example
We’ll start with the following data set:
## Source: local data frame [12 x 6]
##
##    Group Year Qtr.1 Qtr.2 Qtr.3 Qtr.4
## 1      1 2006    15    16    19    17
## 2      1 2007    12    13    27    23
## 3      1 2008    22    22    24    20
## 4      1 2009    10    14    20    16
## 5      2 2006    12    13    25    18
## 6      2 2007    16    14    21    19
## 7      2 2008    13    11    29    15
## 8      2 2009    23    20    26    20
## 9      3 2006    11    12    22    16
## 10     3 2007    13    11    27    21
## 11     3 2008    17    12    23    19
## 12     3 2009    14     9    31    24
This data is considered wide since the time variable (represented as quarters) is structured such that each quarter represents a variable. To re-structure the time component as an individual variable, we can gather each quarter within one column variable and also gather the values associated with each quarter in a second column variable.
long_DF <- DF %>% gather(Quarter, Revenue, Qtr.1:Qtr.4)
head(long_DF, 24)  # note, for brevity, I only show the data for the first two years

## Source: local data frame [24 x 4]
##
##    Group Year Quarter Revenue
## 1      1 2006   Qtr.1      15
## 2      1 2007   Qtr.1      12
## 3      1 2008   Qtr.1      22
## 4      1 2009   Qtr.1      10
## 5      2 2006   Qtr.1      12
## 6      2 2007   Qtr.1      16
## 7      2 2008   Qtr.1      13
## 8      2 2009   Qtr.1      23
## 9      3 2006   Qtr.1      11
## 10     3 2007   Qtr.1      13
## ..   ...  ...     ...     ...
These all produce the same results:
DF %>% gather(Quarter, Revenue, Qtr.1:Qtr.4)
DF %>% gather(Quarter, Revenue, -Group, -Year)
DF %>% gather(Quarter, Revenue, 3:6)
DF %>% gather(Quarter, Revenue, Qtr.1, Qtr.2, Qtr.3, Qtr.4)
Also note that if you do not supply arguments for na.rm or convert values then the defaults are used.
Objective: Splitting a single variable into two
Description: Many times a single column variable will capture multiple variables, or even parts of a variable you just don’t care about. Some examples include:
##   Grp_Ind    Yr_Mo       City_State        First_Last Extra_variable
## 1     1.a 2006_Jan      Dayton (OH) George Washington   XX01person_1
## 2     1.b 2006_Feb Grand Forks (ND)        John Adams   XX02person_2
## 3     1.c 2006_Mar       Fargo (ND)  Thomas Jefferson   XX03person_3
## 4     2.a 2007_Jan   Rochester (MN)     James Madison   XX04person_4
## 5     2.b 2007_Feb     Dubuque (IA)      James Monroe   XX05person_5
## 6     2.c 2007_Mar Ft. Collins (CO)        John Adams   XX06person_6
## 7     3.a 2008_Jan   Lake City (MN)    Andrew Jackson   XX07person_7
## 8     3.b 2008_Feb    Rushford (MN)  Martin Van Buren   XX08person_8
## 9     3.c 2008_Mar          Unknown  William Harrison   XX09person_9
In each of these cases, our objective may be to separate characters within the variable string. This can be accomplished using the separate() function which turns a single character column into multiple columns.
Function:       separate(data, col, into, sep = " ", remove = TRUE, convert = FALSE)
Same as:        data %>% separate(col, into, sep = " ", remove = TRUE, convert = FALSE)

Arguments:
        data:           data frame
        col:            column name representing current variable
        into:           names of variables representing new variables
        sep:            how to separate current variable (char, num, or symbol)
        remove:         if TRUE, remove input column from output data frame
        convert:        if TRUE will automatically convert values to logical, integer, numeric, complex or
                        factor as appropriate
☛ This function is a complement to unite()
Example
We can go back to our long_DF dataframe we created above in which way may desire to clean up or separate the Quarter variable.
## Source: local data frame [6 x 4]
##
##   Group Year Quarter Revenue
## 1     1 2006   Qtr.1      15
## 2     1 2007   Qtr.1      12
## 3     1 2008   Qtr.1      22
## 4     1 2009   Qtr.1      10
## 5     2 2006   Qtr.1      12
## 6     2 2007   Qtr.1      16
By applying the separate() function we get the following:
separate_DF <- long_DF %>% separate(Quarter, c("Time_Interval", "Interval_ID"))
head(separate_DF, 10)

## Source: local data frame [10 x 5]
##
##    Group Year Time_Interval Interval_ID Revenue
## 1      1 2006           Qtr           1      15
## 2      1 2007           Qtr           1      12
## 3      1 2008           Qtr           1      22
## 4      1 2009           Qtr           1      10
## 5      2 2006           Qtr           1      12
## 6      2 2007           Qtr           1      16
## 7      2 2008           Qtr           1      13
## 8      2 2009           Qtr           1      23
## 9      3 2006           Qtr           1      11
## 10     3 2007           Qtr           1      13
These produce the same results:
long_DF %>% separate(Quarter, c("Time_Interval", "Interval_ID"))
long_DF %>% separate(Quarter, c("Time_Interval", "Interval_ID"), sep = "\\.")
Objective: Merging two variables into one
Description: There may be a time in which we would like to combine the values of two variables. The unite() function is a convenience function to paste together multiple variable values into one. In essence, it combines two variables of a single observation into one variable.
Function:       unite(data, col, ..., sep = " ", remove = TRUE)
Same as:        data %>% unite(col, ..., sep = " ", remove = TRUE)

Arguments:
        data:           data frame
        col:            column name of new "merged" column
        ...:            names of columns to merge
        sep:            separator to use between merged values
        remove:         if TRUE, remove input column from output data frame
☛ This function is a complement to separate()
Example
Using the separate_DF dataframe we created above, we can re-unite the Time_Interval and Interval_ID variables we created and re-create the original Quarter variable we had in the long_DF dataframe.
unite_DF <- separate_DF %>% unite(Quarter, Time_Interval, Interval_ID, sep = ".")
head(unite_DF, 10)

## Source: local data frame [10 x 4]
##
##    Group Year Quarter Revenue
## 1      1 2006   Qtr.1      15
## 2      1 2007   Qtr.1      12
## 3      1 2008   Qtr.1      22
## 4      1 2009   Qtr.1      10
## 5      2 2006   Qtr.1      12
## 6      2 2007   Qtr.1      16
## 7      2 2008   Qtr.1      13
## 8      2 2009   Qtr.1      23
## 9      3 2006   Qtr.1      11
## 10     3 2007   Qtr.1      13
These produce the same results:
separate_DF %>% unite(Quarter, Time_Interval, Interval_ID, sep = "_")
separate_DF %>% unite(Quarter, Time_Interval, Interval_ID)

# If no spearator is identified, "_" will automatically be used
Objective: Reshaping long format to wide format
Description: There are times when we are required to turn long formatted data into wide formatted data. The spread() function spreads a key-value pair across multiple columns.
Function:       spread(data, key, value, fill = NA, convert = FALSE)
Same as:        data %>% spread(key, value, fill = NA, convert = FALSE)

Arguments:
        data:           data frame
        key:            column values to convert to multiple columns
        value:          single column values to convert to multiple columns' values
        fill:           If there isn't a value for every combination of the other variables and the key
                        column, this value will be substituted
        convert:        if TRUE will automatically convert values to logical, integer, numeric, complex or
                        factor as appropriate
☛ This function is a complement to gather()
Example
wide_DF <- unite_DF %>% spread(Quarter, Revenue)
head(wide_DF, 24)

## Source: local data frame [12 x 6]
##
##    Group Year Qtr.1 Qtr.2 Qtr.3 Qtr.4
## 1      1 2006    15    16    19    17
## 2      1 2007    12    13    27    23
## 3      1 2008    22    22    24    20
## 4      1 2009    10    14    20    16
## 5      2 2006    12    13    25    18
## 6      2 2007    16    14    21    19
## 7      2 2008    13    11    29    15
## 8      2 2009    23    20    26    20
## 9      3 2006    11    12    22    16
## 10     3 2007    13    11    27    21
## 11     3 2008    17    12    23    19
## 12     3 2009    14     9    31    24